Who lives in cities?
Between
2001 and 2011 the suburbs population grew by 8 per cent,
from 28.45 million to 30.77 million
55 per cent of the total
population of England and Wales live in the suburbs of cities.
City centres are 1.6 per cent of the total population of England and Wales, grew by 37 per cent from 0.66 million to 0.9 million residents.
City centres increases have been driven by young, highly educated, single residents, referred to as ‘millennials’ or ‘Generation Y’.
City centres have a mix of jobs and amenities that are accessed by people from surrounding areas, as well as people living in them.
Suburbs are mainly residential and house the majority of the city and the country’s population.
Residents in city centres are
younger than those in suburbs and hinterlands.
One in three people in cities are aged between 20 - 29 and there are more young people in city centres than other parts of the city.
People are mainly older or are under 19 in the suburbs suggesting their are more families in these areas
People aged between 20 and 29 are also the largest group in the city centres of small
and medium cities.
The majority of city centre residents are single.
Nearly half of residents in city centres are single.
22
per cent of residents are married or in a civil partnership and living together in city centres.
In the suburbs, single people make up 29 per cent of all residents,
but married couples living together make up 43 per cent.
City centre residents are most likely to live in a flat.
Three quarters of residents living in city centres live in a flat or an apartment
London has the highest share of households that live in flats, at 90 per cent, followed
by large cities at 83%.
Residents in city centres are most likely to be students.
In city centres students
make up one in four residents, which is more than the suburbs and hinterland.
The proportion of city centre residents who are employed (42 per cent) is lower
than in other areas of the city.
Residents in city centres are well educated.
One third (35 per cent) of working-age people living in city
centres have a degree, compared to 27 per cent in suburbs and hinterlands.
Over half
(54 per cent) of city centre residents have at least A-level or equivalent qualifications
London in particular has the highest share of residents who are managers or senior
officials, professionals or associate professionals (66 per cent).
City centres of small
cities, on the other hand, have the highest share of residents working in lower skilled
occupations – sales and customer service, process, plant and machine operatives,
and elementary occupations (38 per cent).
City centre residents are less likely to use a car to get to work.
In city centres 32% of residents walk to work which is more
than three times as high as in the suburbs and hinterlands (10 per cent).
In city
centres, less than a quarter commute by car or van, compared to just over a half in
suburbs and two thirds in hinterlands (Figure 10).
This reflects the fact that city centre residents live closer to their workplace.
This reflects the fact that city centre residents live closer to their workplace. 56 per
cent travel less than 5km to work – while just 30 per cent of residents in the rural
hinterlands travel less than 5km.
On average, 35 per cent of city centre residents in 2011 were born outside of the
UK.
http://www.centreforcities.org/wp-content/uploads/2015/07/15-07-20-Urban-Demographics.pdf
https://www.statista.com/statistics/270369/urbanization-in-the-united-kingdom/
In 1950 the population in cities was 79% it is expected in 2030 that 92.2% will live in cities.
https://www.theguardian.com/news/datablog/2009/aug/18/percentage-population-living-cities
The main reasons for people wanting to live in the city centre are:
- to be close to restaurants / lesuire or cultural facilities (39%)
- availability of public transport (28%)
- to be close to local shops (27%)
- to be close to the workplace
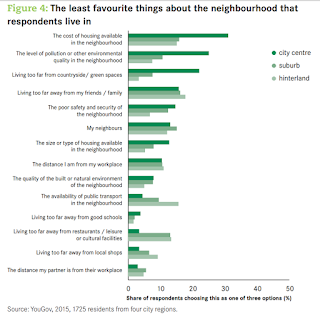
The least favourite aspects of their neighbourhood for people living in the city centre were:
- the cost of housing (31%)
- the level of pollution or other environmental quality (25%)
- living too far from the countryside / green spaces (22%)
13% of 25 - 34 year olds said that their least favourite aspect of their neighbourhood was living too far from the coutryside / green spaces
10% of 18 - 24 year olds said that their least favourite aspect of their neighbourhood was living too far from the coutryside / green spaces
14% of 18 - 24 year olds said that their least favourite aspect of their neighbourhood was the level of pollution / other environmental quality in the neighbourhood
18% of 25 - 34 year olds said that their least favourite aspect of their neighbourhood was the level of pollution / other environmental quality in the neighbourhood
10% of 25 - 34 year olds said that their least favourite aspect of their neighbourhood was the quality of the built or natural environment in the neighbourhood
9% of 18 - 24 year olds said that their least favourite aspect of their neighbourhood was the quality of the built or natural environment in the neighbourhood
http://www.centreforcities.org/wp-content/uploads/2015/11/15-11-02-Urban-Demographics.pdf


No comments:
Post a Comment
Note: only a member of this blog may post a comment.